Как выбрать гостиницу для кошек
14 декабря, 2021
Сегодня каждый, кто собирается в отпуск и не знает, с кем оставить своего котика или кошку, может во[...]
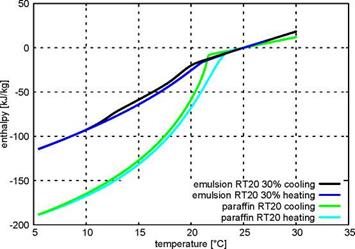
A series of measurements has been carried out with water as reference. Subsequently an emulsion produced by Fraunhofer Institute for Environmental-, Safety — and Energy Technologies (UMSICHT) was tested. This emulsion consists of 30% PCM (RT20) and 70% water. The melting enthalpy is about 60 kJ/kg over a temperature range of approximately 10 K (between 12 °C and 22 °C). Related to the melting temperature range this corresponds to a heat capacity of only 6 kJ/kgK which is only 1,43 times the value of water.
|
Fig. 2: The integrated heat flux curve for the pure RT20 and the utilized emulsion with 30% of the material during cooling and heating; measured with a Calvet-DSC |
|
|
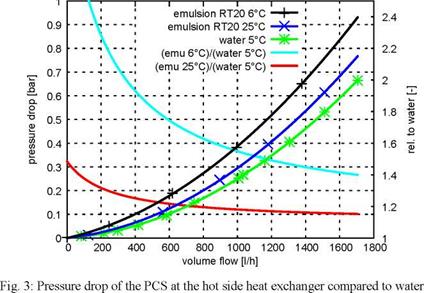
An important figure to evaluate the practicability of a PCS is its viscosity and the resulting pressure drops over different components. If the viscosity is much higher than the one of water, the advantage of higher energy density of PCS may be compensated by the higher hydraulic power necessary for pumping it. Also higher viscosities lead to reduced heat transfer in heat exchangers as the flow tends to laminar regime. Therefore the pressure drop of the phase change emulsion at the hot side heat exchanger was measured and compared to water as shown in Figure 3. The PCS was tested at two temperatures: at 5 °C as it is considered that all the PCM is in solid state and at 25 °C for molten PCM. As expected the viscosity is higher when the PCM is frozen, approximately by 20%. At low flow rates the relative pressure difference compared to water is high; at flow rates with practical relevance (above 300l/h) it takes values between 1,2 and 2. In a real application the PCM will melt or freeze within the heat exchanger, so the real pressure difference will lie between the obtained results.
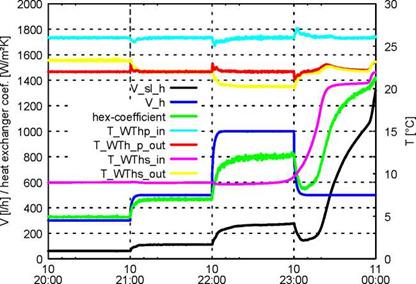
The following measurement was performed simulating a cooling application with 22 °C supply temperature and 26 °C return temperature, so the entire melting range of the material could be used. The storage was cooled down to 10 °C and the chiller then switched off. The heater was set to maintain the 26 °C. For the flow rate in the heating (load) circuit the following profile was defined: 300 l/h — 500 l/h — 1000 l/h — 500 l/h for an hour each, starting at 20:00 (equivalent to approx. 1390 W — 2320 W — 4640 W — 2320 W). The slurry pump was then controlled in such way that the 22 °C supply temperature was maintained independently of the flow rate in the heating circuit.
|
time [day of measurement H:M] Fig. 4: Measured values at the hot side heat exchanger: V_sl_h — slurry flow rate, V_h — heater flow rate, hex- coefficient — heat transfer coefficient, T_WThp_in/out — in-/ outlet temperature of the heater side of the heat exchanger, T_WThs_in/out — in-/ outlet temperature of the slurry side of the heat exchanger |
Figure 4 shows that during the first 3 hours the supply temperature (T_WThp_out) can be maintained constant with low slurry flow rates which means the heat can well be transferred to the slurry. A little before 23:00 the slurry temperature (T_WThs_in) starts to rise, so the controller increases the flow rate in the slurry circuit. The heat transfer coefficient is proportional to the volume flow rate, so the set temperature can be maintained although the temperature difference decreases. Shortly before 24:00 the
storage is entirely discharged, which the controller tries to compensate by setting the pump to full speed.
|
25 |
![]()
|
5 |
![]()
|
10 18:00 |
![]()
|
10 10 10 20:00 21:00 22:00 time [day of measurement H:M] |

|
14 12 10 8 6 4 |
![]()
|
2 |

|
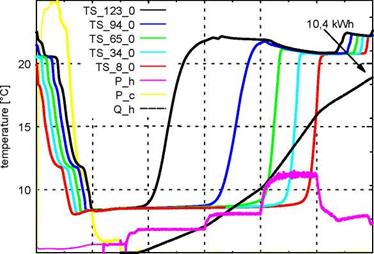
Fig. 5: Process of charging the storage down to 8 °C and discharging to 22 °C; TS_8_0 to TS_123_0 are the temperatures in the centre of the storage at heights from 8cm to 123cm; P_h is the heating power, P_c the cooling power and Q_h the integrated heat |

|
11 00:00 |
![]() лі
лі
>s
о
аз. с
ЛІ о
CL
In Figure 5 one can observe the charging and discharging process of the storage. It is cooled down (charged with cold) between 18:00 and 19:30. As a consequence of stratification the bottom part first reaches the set temperature. At 19:30 the discharging commences and the storage is heated up from the top downwards. The stratification is maintained stable as long as the slurry flow rate remains low. Higher flow rates lead to a mixing within the storage. During the entire discharging process 10,4kWh heat are absorbed by the PCS. Due to the large temperature spread (from 8 °C to 22 °C) this is only 1,3 times the amount of energy which could have been stored in water[15]. The same experiment was carried out with the storage being cooled down to different temperatures. By cooling it down to 14 °C and discharging it under the same conditions as before close to 7 kWh can be stored by the PCS. Water could have stored about 4,6 kWh in the same temperature range, so the PCS has a energy density about
1,5 times higher than water in this case. The same factor was obtained by cooling the storage down to 16 °C.
Figure 6 shows the result of the storage being cooled down to 18 °C. By heating it up to 22 °C roughly 4 kWh can be stored in it. The factor compared to water — which could store about 2,3 kWh in this temperature range — is 1,7
|
28 27 26 25 24 23 22 Q. |
|
1st International Congress on Heating, Cooling, and Buildings — 7th to 10th October, Lisbon — Portugal / |
|
21 |
|
8 |
|
00:00 |
|
05:00 |
|
06:00 |
|
time [H:M] |
|
2^ > — t—■ О (0 Cl |
|
<D |
|
Fig. 6: Process of charging the storage down to 18 °C and discharging to 22 °C, in order to cool the heating |
|
18 16 14 12 10 |
 |
circuit from 26 °C to 22 °C.
This fact implies that the use of PCS is most advisable for small temperature differences. Else the unbeatably high sensible heat capacity of water compensates the advantage of the high latent heat capacity in a narrow temperature band of the PCS.
The testing facility which is operated at Fraunhofer ISE allows the comprehensive analysis and characterization of Phase Change Slurries. Not only can the PCS be evaluated on laboratory scale or under stationary conditions — the testing facility with 500 l storage also facilitates the reproduction of reality-like applications on small scale.
The measurement of one Phase Change Emulsion demonstrates the range of parameters that can be analyzed by this facility. Also the applicability of the material under varying operation conditions is manifested. The relatively low increment in heat capacity at the large temperature band of the presented experiment confirms once more that the relative low fraction of latent storable heat argues for applications where even with water only a small temperature difference can be used. The objective for further research is therefore the development of PCS with higher melting enthalpies in a smaller temperature range. With a high AT water as a very cheap heat-carrier-fluid has clear advantages in comparison to PCS.
Acknowledgement
This paper is based on a project supported by the German Federal Ministry of Economics and Technology. Partners within the project were Fraunhofer Institute for Environmental-, Safety — and Energy Technologies (UMSICHT), IoLiTec GmbH & Co. KG and RubiTherm GmbH.
References
[1] P. Schossig, H.-M. Henning, S. Gschwander, T.. Haussmann, Micro-Encapsulated phase — change Materials integrated into constructions materials, Solar Energy Materials & Solar Cells, 2005, Vol. 89, p. 297-306, 2005
[2] Cristopia Energy Systems, Thermal Energy Storage, Product brochure, 2004
[3] Rubitherm Technologies GmbH, Rubitherm FB, Data sheet, 2006
[3] Y. Tsubota, Y. Okamoto, Prospects of Ice Slurry Systems, including PCM slurries, in Japan, IEA/ECES Annex 18 First Workshop, Tokyo, Japan, 2006
[4] H. Recknagel, E. Sprenger, Taschenbuch fur Heizung — und Klimatechnik 2005/06, Oldenbourg R. Verlag GmbH, 72nd Edition, MUnchen, Germany 2004
[5] S. Gschwander, P. Schossig; Paraffin Phase Change Slurries; 7th Conference on Phase Change Materials and Slurries for Refrigeration and Air Conditioning, Dinan, France 2006