Как выбрать гостиницу для кошек
14 декабря, 2021
Сегодня каждый, кто собирается в отпуск и не знает, с кем оставить своего котика или кошку, может во[...]
A schematic of the experimental test facility is depicted in Fig. 2. Inside the tank, two piping sections are submerged — one for the hot water from the simulated solar system (an electrical water heater), and one for the water from the simulated load (a mechanically cooled water system). The two sections are arranged for a counter flow regime. Flow rates and temperatures of the water inlets and outlets were measured and recorded, along with temperature readings from six thermocouples distributed inside the tank covering the tank diameter. This six tank temperatures were used to analyze the progress of the charging/discharging process in the melting/freezing PCM.
3.2. Results — charging
During charging the temperature and flow rate from a simulated solar heat source was set to a constant value. Below, example charging curves are shown in Fig. 3 where the charging temperature was 75 °C and the flow rate 0.2 m3/h. The figure shows the accumulated energy [kWh] over time (red curve with square symbols), as well as how the power [kW] varied over a charging cycle (blue curve with diamonds).
|
Fig. 2. The Schematic of the Experimental Test Facility. |
 |
Fig. 3. Example charging curves for PCM HEATPACK prototype (charging temperature 75 °C, and flowrate 0.2
m3/h).
In this particular case, over 14 kWh of heat had been charged after 380 minutes. Initially, the power is high due to a large temperature difference (PCM is at room temperature), and relatively high heat
transfer rate at the beginning of the melting cycle. However, the power then drops off to approximately 2 kW, corresponding to a specific power of 14 kW/m3 storage. The drop below 2 kW in power shown in this case is due to a temporary loss in temperature from the heat source (hot water heater).
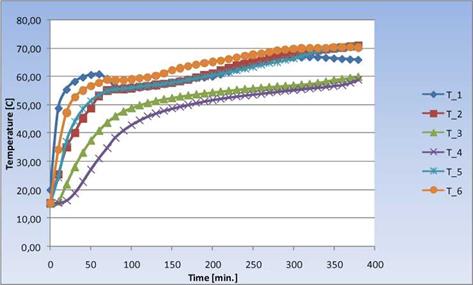
To further examine the charging process, the temperature profiles within the tank were examined in more detail by evaluating temperature measurements from thermocouples submerged in the tank throughout the diameter of the storage. These profiles are shown in Fig. 4.
|
Fig. 4. Example temperature profiles within storage during charging of PCM HEATPACK prototype (charging temperature 75 °C, and flowrate 0.2 m3/h). |
As shown, most of the PCM is molten (temperature reading above 58 °C), however for the parts furthest away from the hot water inlet (T_3 and T_4 thermocouples) the melting temperature is not reached until after 300 minutes.