Как выбрать гостиницу для кошек
14 декабря, 2021
Сегодня каждый, кто собирается в отпуск и не знает, с кем оставить своего котика или кошку, может во[...]
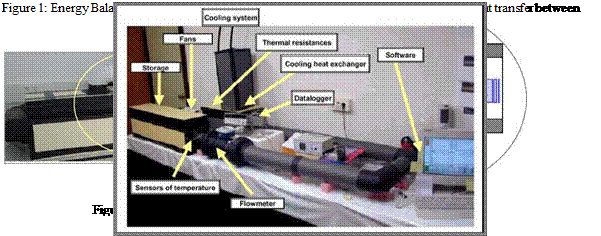
At University of Zaragoza, there is an experimental setup to study the heat transfer between PCM and air (Figure 1). The experimental rig consists of a closed air loop with a storage unit. The air in the loop can be heated and cooled artificially. A PID controller regulates the inlet air temperature in the storage unit. The temperature of the air is measured at the entrance and exit of the storage, using five calibrated Pt100 (uncertainties < 0.05 °C) in each point; air flow is measured using a calibrated flowmeter (uncertainty <0.5%). All data are stored and evaluated with tailor-made software [12].
With this setup, heat capacity as a function of temperature in big samples could be estimated. It is used to evaluate the effect on energy storage capability caused by the addition of PCM.
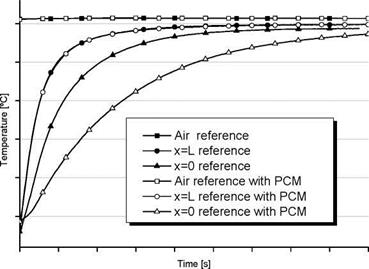
By modifying this rig, it could be used to study thermal response of building materials. This modification consists on building an insulated enclosure where sample is placed so that only one surface is exposed to the air flow. Air flow is then bypassed (Figure 2). Temperature is measured at three points: centre of insulated surface, centre of exposed surface and air temperature at centre of exposed surface. Air temperature is maintained constant by a PID controller. Air flow is measured and set at the same rate for all experiments. Temperatures are registered and then could be compared its evolution for different samples in equal conditions. In order to evaluate thermal response time effect due to PCM, a reference without PCM is used. Then, the sample containing PCM is measured in equal conditions (initial temperature of the samples, airflow rate and air temperature).
|
Figure 2: Energy Balance configuration to test thermal diffusivity |
|
Figure 1: Energy Balance setup to measure stored energy as a function of time and to study heat transfer between PCM and air. |
x=0, T2 x=L, T1
Figure 3 shows an example of comparison of temperature evolution between sample containing PCM and reference. Some results are presented in this conference [13].
|
Figure 3: typical temperature evolution comparison of reference and reference containing PCM samples. |