Как выбрать гостиницу для кошек
14 декабря, 2021
BRAZIL
PART II — THE SOFTWARE AND ITS USE
C. Tfba1*, A. L. B. Candeias2, N. Fraidenraich1, E. M. de S. Barbosa1, P. B. de Carvalho
Neto3 and J. B. de Melo Filho3
1Departamento de Energia Nuclear da Universidade Federal de Pernambuco
Av. Prof. Luiz Freire, 1000 — CDU, CEP 50.740-540, Recife, Pernambuco, Brazil
2Departamento de Engenharia Cartografica da Universidade Federal de Pernambuco
Av. Academico Helio Ramos, s/n — CDU, Recife, Pernambuco, Brazil
3Companhia Hidro Eletrica do Sao Francisco — DTG — CHESF
Rua Delmiro Gouveia, 333 — Bongi, CEP 50761-901, Recife, Pernambuco, Brazil
Corresponding Author, tiba@ufpe. br or chigueru. tiba@pa. cnpq. br
Abstract
This work describes the functionalities of the SIGA SOL 1.0 — Geographic Information System Applied to Solar Energy. The prototype of the GIS tool is made up of three principal blocks: management of installed renewable systems, planning of inclusion of new renewable systems and updating of the data bank. The SIGA SOL 1.0 has a total of 80 layers of information that permit the realization of spatial analyses on management and planning of renewable sources of energy at a macro-spatial level (state) and local (municipality). The system was developed particularly for PV systems as a possible support tool for management and planning of the Program of Energy Development for the States and Municipalities (PRODEEM), a program for inclusion of photovoltaic solar energy on large scale, in the rural medium, conducted by the Ministry of Mines and Energy of Brazil.
Keywords: GIS, Planning and Management, Photovoltaic solar energy, Functionalities, PRODEEM
The GIS is a valuable tool for assesment and development of the use of renewable energy resources in extensive regions because it is a tool that is especially adequate for analyzing the spatial variabilities of the resource, as also for resolving problems of management and planning of programs for installation of decentralized systems, that are characterized by a large spatial dispersion. It can be seen as a support system for decisions that integrate spatially referenced data in an ambient of answers to problems. A GIS groups, unifies and integrates information, thus making such information available in a more accessible manner, and it puts old information in a new context. In this project, the GIS is used as tool that permits the integration and processing of information coming from diverse sources. From this it is possible to use it in the elaboration of strategies for implanting and management of the rural electrification programs with renewable sources of energy.
Although the approach for developing polymeric collectors is rather an approach from the material side, some requirements for the use in domestic hot water heating and possibly heating support should be met regardless of the used material. It is very important, that temperatures of up to 90 — 100°C are tolerated. In addition, UV-stability is essential as well as chemical resistance to the heat transfer fluid. Other properties that are important in the end are e. g. the absorption, heat conductivity, mechanical stability and processability.
Some appropriate polymers and a selection of important properties are presented in table 1. They have been used for the different calculations and might be candidate materials for solar thermal applications. The values used are a compilation from various sources.
Most thermoplastics — including the ones mentioned in the table — are extrudable, so the advantages of this well-known, effective continuous process can be used. However, it seems to be impossible to find one polymer that fulfils all the aforementioned needs as it is. Thus, one has to look for possibilities to modify polymers in order to serve one’s purposes. Additives and fillers might be used to increase the heat conductivity, as well as the heat stability and they can be used as a protection against UV-radiation if no special UV-screen on top of the polymer is used.
|
Table 1. Properties of contemplated polymers
|
For an accurate simulation result it is essential to truthfully reproduce the optical properties of the different materials of the thermal collector. That means to clearly define for example the geometrical dimensions since they correlate directly with the IAM-values. For this purpose the program OptiCAD offers the opportunity to check the defined geometrical, energy-related and optical parameter by a visual 3-D presentation which is based on the entered data. This is very helpful because non-conformances and errors in entered data can be identified very quickly.

The absorber and the glass cover of a flat-plate collector represent the most relevant optical units for a ray-tracing simulation. Figure 1 shows the interaction of a light beam with two transparent covers and an absorber. Effects like refraction of rays and multiple reflections of them within the glass covers as well as between them and the absorber are well to be distinguished.
In OptiCAD, the optical properties of the solar glass can be calculated by declaring the absorption coefficient and the refraction index. The transmission of solar radiation incident under a specific angle is calculated in the program by applying the Fresnel equations.
The optical properties of the absorber are implemented in OptiCAD according to their measured data. In addition to the capability of absorption the fraction of reflection under different incident angles plays an important role since the portion of reflected radiation increases with increasing incidence angle.
The mode of reflection of rays (direct or diffuse) at the reflectors of concentrating collectors is as substantial as the fraction of reflection. Modelling of scattered reflection in OptiCAD has been treated in [1].
Due to polarisation of light after passing one glass cover it is important particularly in case of collectors with multiple covers to investigate the optical characteristics by utilising a polarised light source. The software OptiCAD then is able to detect the state of the light’s polarisation after passing through the transparent covers and incorporates such effects in its simulation calculations.
|
Fig. 2. Comparison of measured and simulated transmission of polarised light of one solar glass |
In Figure 2 the measured transmittance of one antireflective treated solar glass weighted with the solar spectrum AM 1.5 for s-, p — and non-polarised light is plotted over the incidence angle. The transmittances simulated with the ray-tracing program OptiCAD are also shown in the figure for comparison. It can be seen that the curves fit very well, whereby the adequate performance of the software is demonstrated.
Assuming that the process is stationary, the temperature field in the OiABC section in the Descartes coordinate system O1xz with O1 as the initial point is described by the Laplace equation
[4] :
52 71 52 71 (1)
1 1 = 0, дx2 dz2
 |
|
We will introduce dimensionless variables and parameters [5], the dimensionless temperatures will be described by the formulae:
where
2 is the heat conductivity of the collector plate, W/m-K; q is the density of the solar heat flow, W/m2; h is the plate’s thickness, m.
2b is the distance between the tubes’ axes, m; r0 is the inner radius of a tube, m.
The Laplace equation and boundary conditions in the dimensionless form will be:
|
д 2©1 + d 2©1 0. dt2 дд2 ; |
(6) |
|
д©дМ= Q ; дд |
(7) |
|
д©1 (t,0) = дд ’ |
(8) |
|
д©1 (0,?) = 0. дt ’ |
(9) |
|
(10) |
The solution to the problems (6)-(10) is
©1 Ы=Q fe2 V)+1-
To estimate the validity of the model developed to generate DHW (Domestic Hot Water) profiles from time-use data the modelled profile for an average household member living in an apartment was compared to measured data. Figure 1 shows the hourly distribution for a weekday and a weekend day when averaged over six analysed measured months. The total hot water demand according to the model is 6.4 kWh per average person and day on a weekday and 7.3 kWh per person and day on a weekend day. The measurements, on the other hand, show an average use of 7.9 kWh for a weekday and 8.7 kWh for a weekend day.
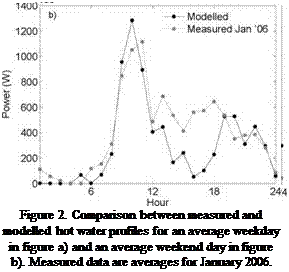
In Figure 2 the modelled profiles are compared to measurements for one single month, in this case January 2006. Compared to the average measured profile the typical pattern is more clearly distinguished, especially in the morning, when investigating individual months. That is due to the peaks levelling out when averaged, since the peaks in power demand appears at different time different months of the year. See further in Section 3.3.
 |
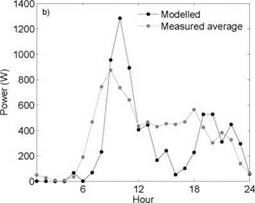 |
Figure 1. Comparison between measured and modelled hot water profiles for an average weekday in figure a)
and an average weekend day in figure b). Measured data are averages for six different months.
As seen mainly in Figure 2 the overall patterns in hot water demand between modelled curve and measured an individual month agree well, both showing clear morning peaks and smaller evening peaks. The magnitude of the peaks is also similar. The peaks however appear on somewhat different times in the morning. This may be due to that the two measured buildings are situated in an area, where most residents commute rather long distances to work, and therefore have showers earlier in the morning compared to the average person in the larger time-use study.
The modelled hot water demand for weekdays and weekend days was combined to form annual loads. The total hot water demand according to the model was 2.4 MWh per average person and year in an apartment (for a household member in a single-family house the figure was 1.6 MWh). This can be compared to the measured hot water use in the 24 apartments in Vasteras, where the average demand was 2.8 and 2.5 MWh per average household member for 2005 and 2006 respectively.
Ricardo Aguiar*, Ricardo Coelho, Pedro Horta and Maria Joao Carvalho
INETI, Department of Renewable Energies, Lisbon, Portugal
* E-Mail: ricardo. aguiar@ineti. pt, Tel: +351 210 924 602
The influence of the incidence angle 0 on the performance of solar collectors has long been recognised and is accounted for in collector testing, as well as in solar system performance estimation and design, through the incidence angle modifier function, K(0). However, the usual approach taken to measure, describe and use it for computations has been pointed out as oversimplified, especially in the case of 2D collectors, such as CPCs or vacuum tubes with mirrors inside.
For flat plate collectors, standard practice assumes K(0) =[1+ b0 (1/cos 0)c ]+, measures the response of the solar collector at 0= 50°, assumes e. g. K(85°) = 0.85, and uses these data to find b0 and c. This curve is then used for computations, e. g. system performance and sizing.
However, for 2D collectors K(0) can take a non-monotonic shape and be larger than 1, meaning that optical performance is not maximum at perpendicular incidence. In addition, 2D collectors generally present an axis of symmetry, and their response is different in the longitudinal and transverse directions in respect to that axis. While this is generally not a problem when considering beam radiation (B), it complicates the treatment of diffuse radiation — both celestial (D) and ground reflected (R) — and leads to a case-by-case approach, according to collector geometry. Furthermore, this introduces bias when testing flat-plate and 2D collectors: the diffuse radiation absorbed by the different collector types is not taken into account at a levelled basis.
Thus, 2D collector performance comes out affected when the full scope of optical effects over different radiation components can’t be dully decoupled and a calculation based on the irradiation of the aperture plane is used: viz. the instantaneous power per unit area q is estimated as q = no K(0)G — a1 AT — a2 AT 2/G (with n0, au a2 the experimental coefficients, G the global radiation per unit area at the surface of the collector, and AT the temperature jump between hot water exiting the collector and the ambient).
Three different performance indicators defined initially in Task 26 and adapted to Task 32 are shown in the Excel tool developed to evaluate the simulation results. They are compared with a reference system which has no collectors and all the energy is provided by fossil energy [6]. The three performance indicators evaluated are the thermal energy savings (fsav, therm), the extended thermal energy savings (fsav, ext) and the fractional solar savings indicator (fsi) and are defined in Eq. 1 to Eq.3.
The fractional thermal energy savings (fsav, therm) are a measure of the percentage the auxiliary (nonsolar) energy input for heating can be reduced with the solar system, this term does not account for electricity use unless it is used directly for heating and it is defined as:
Qboiler + Qel, heater
П boiler, ref
The extended fractional energy savings (fsav, ext) are defined in a similar way than the fractional thermal energy savings (fsav, therm), but they also include electricity use for pumps, valves, controllers etc.
Qboiler. Qel, heater + Wpar
Finally, it is theoretically possible to achieve a high fsav, therm and at the same time not meeting the comfort criteria for space heating or warm-water production. Therefore the fractional solar savings indicator (fsi) includes a penalty term that compensates and even punishes for not meeting comfort criteria and it is defined as:
nboiler, ref n el
where:
Qboiler [kWh]: Energy delivered to the system by the auxiliary boiler (energy balance on the water-side of the boiler)
Qboiler, ref [kWh]: Energy delivered to the reference system (system without solar) by the boiler in the reference system (energy balance on the water-side of the boiler)
Qel, heater [kWh]: Energy delivered to the system by an electrical heater
nboiler [-]: Efficiency of auxiliary boiler of the solar system (dependent on the overall system) nboiler, ref [-]: Efficiency of auxiliary boiler of the reference system (= 0.85)
nel [-]: Efficiency of electricity production and transport to the site of use (= 0.4 independent of the source)
Wpar [kWh]: Electricity used for pumps, valves, etc. as well as for direct heating or driving a heat pump Wpar, ref [kWh]: Electricity used for pumps, valves, etc. of the reference system Qpenalty [kWh]: Penalty for the solar system for not meeting comfort criteria Qpenalty, ref [kWh]: Penalty for the reference system for not meeting comfort criteria
Two different kinds of penalties were considered, a penalty function for not meeting the required tapping water temperature of 45 °C (Qpen45), and a penalty function for not meeting comfort criteria (Qpen20) [5]. The penalties evaluation is also an important parameter whose influence is reflected in the fractional solar savings indicator (fsi) as shown in Eq. 3 where Qpenalty are the total penalties (DHW plus heating).
For the first set of simulations, where the aim was to observe the influence of some parameters in the result of the simulations, the most influencing parameter was the position of the outlet to the space heating (Z_SbB). This parameter had a strong influence on the three different performance indicators. On the other hand, the position of the auxiliary temperature sensors that operates the auxiliary system shows a slight influence on the results. Analyzing the influence of the position of Z_SbB (Table 1), it was easy to conclude that the lower the relative position of the outlet to the space heating, the better the value of the performance indicators fsav, therm and fsav, ext. However, the value of the fsi performance indicator was worst because of high penalty values, taking into account that Qpenalty, ref (Eq. 3) has always the same value. It was also seen that the fossil fuel used decreased with a lower position for the outlet to the space heating. When the outlet to the space heating was placed at a higher position, the value of the penalties was lower and the fsi indicator was also better.
|
Table 1. Variations on the position of the outlet to the space heating (Z_SbB)
|
A lower position of the space heating outlet reduces the penalties regarding the DHW demand at 45 °С. This is because the water placed above the Z_SbB outlet is at a higher temperature and therefore, it is easier to provide water at the set point temperature of 45 °С. However, the water temperature going to the space heating system is at a lower temperature, thus it has less energy to release to the ambient and it is more difficult to reach the comfort temperature of at least 19.5°C inside the building.
A higher position of the space heating outlet benefits the heating system. The operation time of the space heating system is lower because the water going to the heating is at a higher temperature and more energy is released to the ambient reaching easier the comfort temperature. However, this is a drawback for the DHW demand and the penalties for it increase.
For the second set of simulations the aim was to check the influence of the PCM modules characterization. That is the placement of the PCM modules, the length of the modules and the amount of PCM. Several simulations were performed with variations of the length and diameter of the modules, which involved a variation of the number of PCM modules, and as a consequence, a variation of the PCM volume into the store (Table 2). Only slight improvements up to 2% in the performance indicators were obtained, when compared with the reference simulation without PCM in the tank. However, this small advantage is within the numerical uncertainties in the calculations [7]. Also the amount of energy provided by the auxiliary system had very few variations. Some more simulations without the stratifier device were carried out with and without PCM but the performance indicators showed no difference. The water store resulted to be at least as good as a water-PCM store.
The highest variation (2%) is observed in the fsi indicator, which is the one that considers the penalties when the demand, DHW or space heating, is not fulfilled. Concerning a PCM-water store, penalties are always smaller compared with a water store (Table 2). They can be even completely avoided in a PCM-water store with the same characteristics of a water tank. Therefore, the introduction of PCM helps to decrease the penalties for not reaching the specified conditions.
|
Table 2. Variations of the PCM modules geometry
|
Advantages offered by PCM have been already tested theoretically and experimentally in DHW installations. Several simulations were performed to check its suitability in a DHW and space heating demand system. A complete and powerful tool with Trnsys was developed in the framework of Task 32 of the International Energy Agency (IEA) to perform simulations with this system.
Two different set of simulations were carried out. For the first one, where the aim was to observe the influence of some parameters in the result of the simulations (three performance indicators: fsav, fsav, ext, fsi), the most influencing parameter was the position of the outlet to the space heating. The lower the relative position of the outlet to the space heating, the better the value of the performance indicators fsav, therm and fsav, ext but the worst the value of fsi because of high penalty values. This parameter has a strong influence on the performance of the system since the outlet position benefits one of the demands but affects negatively the other one. Another important conclusion is that the fossil fuel used decreased with a lower position for the outlet to the space heating.
For the second set of simulations the aim was to check the influence of the PCM modules characterization. New placement and modules configuration was tested. Only slight improvements up to 2% in the performance indicators were obtained when compared with the reference simulation without PCM in the tank. Even some simulations without the stratifier device were carried out but no differences were observed concerning the performance indicators. A water store was at least as efficient as a PCM-water store. The highest variation (2%) is observed in the fsi indicator, which is the one that considers the penalties when the demand, DHW or space heating, is not fulfilled. DHW penalties are always smaller in the PCM water store than in the water store with the same characteristics and they can be even completely avoided in a PCM-water store. Therefore, the introduction of PCM helps to decrease the penalties for not reaching the comfort conditions in the demand.
With the system designed as it is and the control applied (typical differential control for simple water tank), only slightly better results were obtained for a PCM-water store compared to a water store regarding the performance indicators used. However, this system is not the commonly used only-water store, it is a PCM-water store so the differential control applied could be no the suitable for this application. A new control strategy taken into account the PCM should be applied. Another possibility could be a new composition of the system, this is for example placing the auxiliary system out of the store.
The work was partially funded with the project ENE2005-08256-C02-01/ALT and 2005-SGR-00324. Dr. Marc Medrano would like to thank the Spanish Ministry of Education and Science for his Ramon y Cajal research appointment.
[1] M. Nogues, L. F. Cabeza, J. Roca, J. Illa, B. Zalba, J. M. Marin, S. Hiebler, H. Mehling, Efecto de la Insercion de un Modulo de PCM en un Deposito de ACS. Anales de la Ingenieria Mecanica, vol 1 (2002) 398-402.
[2] L. F. Cabeza, M. Ibanez, C. Sole, J. Roca, M. Nogues, Experimentation with a water tank including a PCM module, Solar Energy Materials and Solar Cells, 90 (2006) 1273-1282.
[3] M. Ibanez, L. F. Cabeza, C. Sole, J. Roca, M. Nogues, Modelization of a water tank including a PCM module, Applied Thermal Engineering, 26 (2006), 1328-1333.
[4] C. Sole, M. Medrano, A. Castell, M. Nogues, H. Mehling and L. F. Cabeza, Energetic and exergetic analysis of a domestic water tank with phase change material, International Journal of Energy Research, 32 (2008) 204-214.
[5] R. Heimrath and M. Haller (2007). Project Report A2 of Subtask A: The Reference Heating System, the Template Solar System.
[6] W. Weiss, (2003). Solar Heating Systems for Houses. A design handbook for solar combisystems, JamesXJames, London (United Kingdom).
[7] E. Talmatsky and A. Kribus, PCM storage for solar DHW: An unfulfilled promise?, Solar Energy, in press.
E. Bertram1*, J. Glembin1, J. Scheuren1, G. Rockendorf1, G. Zienterra2
1 Institut fur Solarenergieforschung Hameln (ISFH),
Am Ohrberg 1, 31860 Emmerthal; Germany
2 RHEINZINK GmbH & Co. KG, Bahnhofstrafie 90, 45711 Datteln; Germany
* Corresponding Author, s. bertram@isfh. de
Abstract
Two heat pump-systems with borehole and unglazed solar thermal collector are measured and simulated in TRNSYS as part of a research project. Compared to systems without collector the collector yield increases the average temperature level of the heat pump system on the evaporator side. A collector model is developed and evaluated considering the longwave radiation exchange and the condensation heat gains. The annual collector yield is measured as 545 kWh/m2a, of which 4% are determined as heat gains through condensation. Further simulations in TRNSYS show the interdependency of collector area, borehole length and heat pump system performance. The additional heat source component collector reduces the required borehole length and simultaneously improves the heat pump system performance in comparison to a solely borehole supported heat pump. In addition the system sensitivity for the heat source parameters is reduced significantly, thus resulting in a more certain system planning and operation.
Keywords: heat pump system, unglazed solar thermal collector, condensation heat gains
Unglazed solar collectors (SC) provide a high collector yield at a low temperature level. They may therefore be applied to the best advantage as heat source in heat pump systems (HPS) [1]. During winter, in the period of maximum heating demand, unglazed SC can gain heat on a very low temperature level only. Thus a second heat source is needed, which offers ambient temperature independent heat to the HPS. As such heat sources vertical borehole heat exchangers (BHE) are applied.
The role of an unglazed SC is to increase the source temperature level of a HPS, showing an enormous potential for reducing the electrical consumption of the heat pump. If the average temperature level of the heat source is increased by 5 K the annual HPS performance factor (HPF) improves from 3.4 to 4.0. The HPF is defined as the heat supplied by the heat pump divided by its electricity consumption for one year of operation.
In such a two source HPS application the solar heat is either supplied directly to the heat pump condenser or to the BHE. The heat is transferred to the BHE for thermal regeneration of the cooled soil surrounding the BHE. A direct use of the solar heat for space heating or domestic hot water preheating is not regarded in this paper. These solar assisted ground coupled systems offer a high dynamic, a complex interdependency and particularly unknown behaviour, which can not be described properly with common steady state methods used for BHE dimensioning. Hence detailed numerical simulations are required. The realization and evaluation of two HPS pilot plants were in
the focus of a research project, where a TRNSYS-simulation configuration could be validated and used for further extrapolating studies.
The first step leading to a realistic thermosiphon simulation model is the implementation of a double mantle heat exchanger storage tank. This development was carried out based on a simple hot water storage model already available in CARNOT and a validated TRNSYS double mantle heat exchanger storage tank model developed at Malaga University, Spain [5].
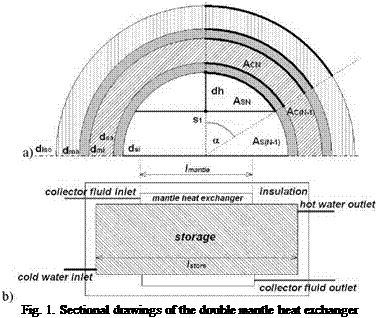
In order to consider stratification effects within the hot water storage, it is necessary to divide it into n user settable vertical layers with either a uniform height or volume. Figure 1a shows one volume segment of height dh and the storage section it affects in terms of energetic calculations (dotted lines). The model is one-dimensional and, therefore, the storage is not divided into additional layers alongside its length. Hence every volume element of the model is calculated using the full length of the storage (Figure 1b).
The thermal behaviour of the model is described by mathematical-physical correlations within every node. For every element in the collector fluid and the tap water, the energy balance is drawn. Within this energy balance, the changes of the inner energy of every element have to be equal to the difference of the entering and leaving heat flow (1, 2).
The main advantage of the CARNOT model in comparison to the TRNSYS model can be found in the way the storage model is discretised.
The storage model in TRNSYS does not consider the heat conductivity of the mantle and storage as well as the transfer coefficients of all materials (including liquids) directly. In order to describe the heat flux within the TRNSYS model, the convective heat transmission on the surfaces and the heat conduction through the different layers, like e. g. steel or insulation materials, are combined resulting in an overall heat transfer coefficient. This coefficient has to be estimated and validated by measurement data. The advantage of this method is the reduced amount of variables, e. g. if there are unknown conditions, there is just one parameter to estimate.
The major advantage of the more complex model built for CARNOT is the possibility to use this model in optimization and development simulations, as almost every important parameter — like materials and geometric values — can be tuned. Figure 2 shows the calculated heat transfer mechanisms heat conduction and convection.
The TRNSYS model uses the same length for the inner and outer mantle of the storage. In the CARNOT model, these lengths can be varied. This has the advantage of adapting the length and fluid capacity of real double mantle storages, as shown in Figure 1. The model calculates the heat transfer from the heat exchanger to the tap water only according to the heat exchanger length lma„ae (Figure 1a). For the rest of the storage length the occurring heat loss from the hot water through the storage material, the insulation and the convective losses into the surrounding ambience is calculated.
Besides the thermal part of the storage, the calculation of the pressure drop is one of the most important variables in thermosiphon systems, as the circulation of the system is maintained by very small pressure differences, due to density decrease or temperature increase along the collector, in the range of 10 — 300 Pa (or 1 — 30mm water column) [6]. The model considers the pressure drop according to height differences in the storage between entering and returning pipes (Figure 1). The dynamic pressure drop resulting from differences in velocity between the piping and the heat exchanger is calculated using the flow rate and the geometrical parameters of entering pipes and storage tank. Bends and other obstacles at the connection between the piping and the storage’s heat exchanger mantle are described by additional friction coefficients. As the velocity of the heat
transfer fluid within the double mantle heat exchanger is nearly zero, there is no dynamic pressure drop calculated.
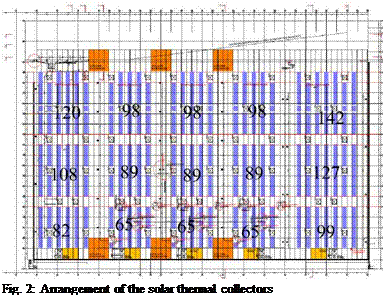 |
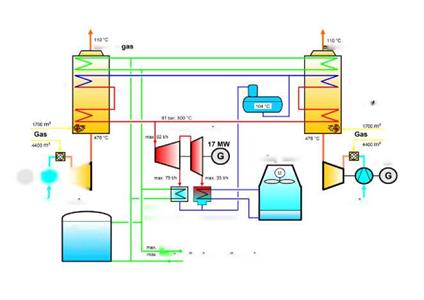 The existing district heating grid will now be extended by a solar thermal feed-in. The heating grid will be supplied by the produced energy of a solar thermal power plant (collector area: 3.700m2m, Fig. 2) via a heat exchanger. Since the solar thermal heat is almost always used immediately, no additional buffer storage are necessary, energy oversupply can be stored in the thermal storage tank in case of need.