

Как выбрать гостиницу для кошек
14 декабря, 2021
Сегодня каждый, кто собирается в отпуск и не знает, с кем оставить своего котика или кошку, может во[...]
C. Castellon1, M. Medrano1, L. F. Cabeza1*, M. E. Navarro2, I. Fernandez2, A. Lazaro3, B. Zalba3
1 GREA Innovacio Concurrent, Edifici CREA, Universitat de Lleida, Pere de Cabrera s/n, 25001-Lleida (Spain)
Phone: +34-973 003576, Fax: +34-973 003575
2 Departamento de Ciencias de los Materiales e Ingenieria Metalurgica, Universitat de Barcelona, Marti i
Franques 1, 08028-Barcelona (Spain). Phone: +34-93 4021298, Fax: +34-93 40335438
3 Instituto de Investigation en Ingenieria de Aragon. I3A, Grupo de Ingenieria Termica y Sistemas Energeticos.
(GITSE) Dpto. Ingenieria Mecanica. Area de Maquinas y Motores Termicos. Universidad de Zaragoza. Campus
Politecnico Rio Ebro. Edificio “Agustin de Betancourt”, Maria de Luna s/n. 50018 Zaragoza
Telefono: 976762567, Fax: 976762616
Corresponding Author, lcabeza@diei. udl. cat
Abstract
An option in building materials is the sandwich panel, which offers excellent characteristics in a modular system. The use of these panels means an advance in the construction area and insulation of buildings, sports, industrial buildings surfaces, artificial drying places, etc. They integrate the functions of cladding, thermal insulation, watertightness, mechanical strength and aesthetic appeal. It is a product composed of a ribbed sandwich panel formed by two sheets metal and insulating polyurethane core injected.
The high insulating value of the polyurethane foam allows important savings in the energy consumption. The stability of the polyurethane, resistant to water and numerous chemical compounds, as well as its immunity to the attack by biological agents, guarantees the durability of the insulation level and the quality of the product.
The goal of this study was to demonstrate the feasibility to use the microencapsulate PCM (Micronal BASF) in sandwich panels to increase its thermal inertia, and therefore, reduce the energy demand of the final buildings.
To manufacture the sandwich panel with microencapsulated PCM, this was added a step before (test 1) and after (test 2) the injection of the polyurethane, test 3 was to mix microencapsulated PCM with one of the components of the poliurethane. The sandwich panel with PCM contains about 8% in weight of PCM mixed with the polyurethane. A sample without PCM, manufactured moments later, was kept as reference.
Keywords: sandwich panel, PCM, thermal energy storage, microencapsulation
Nowadays, reduce the energy consumption is important for existing buildings as well as for new buildings. The literature is full of extensive literature reviews and practical studies about this topic, which were carried out during the last decades [1-4]. These technical efforts concluded that it is necessary to develop materials and techniques to minimize the use of non-renewable energy for air conditioning purposes in buildings.
Phase Change Materials (PCMs) have been considered for thermal storage in buildings since before 1980. With the advent of PCM implemented in gypsum board, plaster, concrete or other wall covering material, thermal storage can be part of the building structure even for light weight buildings. In the literature, development and testing were conducted for prototypes of PCM wallboard and PCM concrete systems to enhance the thermal energy storage (TES) capacity of standard gypsum wallboard and concrete blocks, with particular interest in peak load shifting and solar energy utilization.
During the last 20 years, several forms of bulk encapsulated PCM were marketed for active and passive solar applications, including direct gain. However, the surface area of most encapsulated commercial products was inadequate to deliver heat to the building after the PCM was melted by direct solar radiation. In contrast, the walls and ceilings of a building offer large areas for passive heat transfer within every zone of the building [5]. Several researchers have investigated methods for impregnating gypsum wallboard and other architectural materials with PCM [6-9]. Different types of PCMs and their characteristics are described. Manufacturing techniques, thermal performance and applications of gypsum wallboard and concrete block, which have been impregnated with PCMs, are discussed in several references [10, 11 and 12].
The temperature inside a building depends, among other things, on the outdoor temperature and on the heat capacity of the construction material and other components in the building.
An option in building material is the sandwich panel, which offers excellent characteristics in one modular system. The use of these panels means an advance in the construction area and insulation of buildings, sports, industrial buildings surfaces, artificial drying places, etc. They integrate the functions of cladding, thermal insulation, watertightness, mechanical strength and aesthetic appeal. It is a product composed of a ribbed sandwich panel formed by two sheet metals and insulating polyurethane core injected.
The high insulating value of the polyurethane foam allows important savings in the energy consumption. The stability of the polyurethane, resistant to the water and numerous chemical compounds, as well as its immunity to the attack by biological agents, guarantees the durability of the isolation level and the quality of the product (Figure 1).
The goal of this study was to demonstrate the feasibility to use a microencapsulate PCM (Micronal BASF) in sandwich panels to increase its thermal inertia, and therefore, reduce the energy demand of the final building.
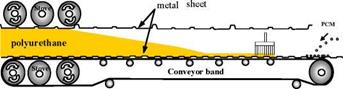
The experiment was performed in the company Europerfil. The conventional process of manufacturing sandwich panel is a continuous injection of insulating polyurethane core between two metal sheet of galvanized pre-lacquered steel.
|
Figure 1View of the sandwich panel |
For the addition of PCM, two options were studied:
• Modifying the manufacturing process, with the addition of a new step to include microencapsulated PCM, this process have 2 options (test 1 or test 2)
• Without modify the standard manufacturing process, adding a mix of polyurethane and PCM denominated test 3.
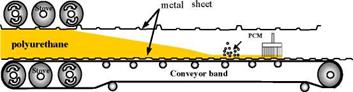
Test 1, the PCM was added at the beginning of the process (before the injection of the polyurethane) (Figure 2), the second one (test 2), the PCM was added after the polyurethane (Figure 3).
|
Figure 2 Manufacture of the sandwich panel with PCM (Test 1) |
|
Figure 3 Manufacture of the sandwich panel with PCM (Test 2) |
Both options were tried manually in the company with the purpose of testing which was the best way to distribute the microencapsulated PCM in the sandwich panel. For each procedure, a reference sample was kept.
Test 3 consists in mix microencapsulated PCM with one of the liquid component of the polyurethane. This process was tested with collaboration of the company PLASFI, and was studied only with the insulating polyurethane (without including the metal sheet).
The sandwich panel with PCM contains about 8% in weight of PCM mixed with the polyurethane. Table 1 shows properties of microencapsulate PCM.
|
Table 1 Properties of Micronal BASF as given by the manufacturer
|
The samples were divided in sections and the following tests were carried out:
Distribution of the PCM: with the help of the stereoscope the distribution of the PCM in the samples were analyzed.
Adhesion test: in order to see if the values are within the limits established by the standard UNE 41950 (L. MAX > 0.10 MPa).
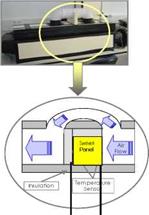
Thermal performance test: the measurements were performed in two experimental installations at the University of Zaragoza [13] (figure 4) and at the University of Barcelona. Here, the panel sandwich sample was insulated in all surfaces but one. The airflow collides on the free surface. Temperature sensors are connected on the front free surface and on the back surface of the sandwich panel. Airflow temperature is controlled during all the experiment. The temperature evolution during the experiment is measured for different samples (Figure 4).
|
X2, T2 X1, T1 |
Figure 4 Experimental installation to measure the temperature evolution in a solid sample (University of
Zaragoza). X1=free surface; X2= insulated surface
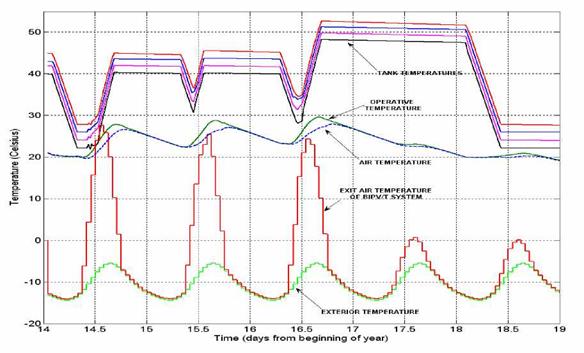
For space heating, a simple PI control strategy is used to obtain the prescribed setpoint. To avoid overheating, if the temperature at 6:00 a. m. exceeds the setpoint, the theatre curtains are moved to a position depending on the radiation expected for the current day. In order to incorporate predictive control, the design of control strategies has been based on a simple control strategy: both the tank temperature setpoint (active storage) and the operative temperature (an indicator of the status of passive storage) depend on current conditions and the solar irradiance expected for the following day. Some results of applying this control strategy are shown below.
|
Figure 5. Results of the application of a predictive control strategy for a SSSCC sequence. |
|
Figure 6. Power consumption of the heat pumps and generation of the PV system for the case of Fig. 5. |
It has been found that heating can be provided over the 2 cloudy days following the first three sunny days without using the ground source heat pump. It has also been found that the PV generation exceeds the power consumption of the heat pumps. As no additional electric power is needed for the grid, this has interesting implications for load management. As expected, the heat pumps consume more energy as the tank gets hotter. This is one factor that should be considered in the design of the control strategy. It has been calculated that over these 5 days, the heat pumps consumed approximately 61 kWh for heating the house. The total yearly electric energy consumption of the house has been calculated to be about 7100 kWh, of which 2500 kWh is consumed by the HPs. The PV panels generate 8600 kWh. The remaining energy (1500 kWh) is intended to be used for the plug-in hybrid car.
Under consideration of the natural convection flow of Newtonian fluid in a vertical cylinder domain and after introducing the Boussinesq approximation, the phenomenon is governed by mass, momentum and energy equations written in dimensionless form:
|
vV = 0 |
(1) |
|
DV = Vp + Pr v 2V * Ra Prd Dt |
(2) |
|
Dl = v-e Dt |
(3) |
*
where, t dimensionless time step, dimensionless temperature, p* dimensionless pressure and V* dimensionless velocity.
In the model, laminar flow and constant physical properties except density variations in buoyancy terms of the momentum equations (Boussinesq approximation) have been assumed. The flow field and the heat transfer are determined by the following dimensionless parameters: aspect ratio H/D, Prandlt number Pr and Rayleigh number Ra.
According to equation (4), (8), (21) and (23), Thermosyphon performance depends on the solar pond temperature vise versa. The explanation can be done as follows, while the solar pond has low temperature, thermosyphon have a low performance. This is because of high thermal resistant inside thermosyphon. Solar pond will, later, have high temperature. Since there are heats in solar pond to be extracted, thermosyphon performance will also increase. A large amount of heat, consequently, is extracted by thermosyphon. These results in decreasing of solar pond temperature thermosyphon performance will decrease again. This situation cycle occur continuously in extraction process. As discussion above, we can see that solar pond temperature and heat extracted by thermosyphon are very with time. Detail of the time series solar pond temperature and extracted heat will be shown later.
2.3 Simulation flow chart
The general information of thermosyphon and solar pond such as geometry, location, and initial pond temperature and operation time will be input to program. When the general information already be input, the heat transfer rates for thermosyphon (Qthermosyphon) will be tried, to be used in equation (4). By numerical method, the temperature of solar pond at LCZ can be determined. Now the actual performance of thermosyphon can be determined. Comparing the trial heat transfer with values from later calculation, if they are equal then the calculation finishs, otherwise the program begins a new trial by set trial value equal to the last calculation values. The calculation will be done again until both are equal. This obtained value is the amount of heat extracted from solar pond by using thermosyphon.
The heating and cooling demands of each modelled zone are predicted in TRNSYS assuming initially that a 100% efficient heating and cooling system is in operation to maintain comfort 24 hours a day. The system adjusts the zone temperature according to the thermostat settings which have been set to satisfy thermal comfort requirements for the occupants.
Table 2 shows the recommended temperature settings suggested by CIBSE [10], based on stated values of met and clo, and a PMV of ±0.25. Where specifically indicated (*) a more tolerant thermal comfort requirement (±0.5 PMV) was used in the calculations of the thermal comfort conditions. These temperature bands were used as thermostat settings in the 12 models.
|
Table 2. Thermal comfort requirements according to CIBSE guide A
|
1.1. Compact Chemical Seasonal Storage of Solar Heat (ECN and TU Eindhoven, Holland)
The main findings of the studies on storage through chemical reactions, as reported by ECN and TU Eindhoven, are the following:
• An extensive theoretical study at ECN [2, 3] indicated magnesium sulphate heptahydrate as potential interesting storage material using the following reversible reaction: MgSO4.7H2O(s) + heat «• MgSO4(s) + 7H2O(g). The theoretical storage density of the material is 11 times that of water [4].
• Initial characterization experiments reveal that the dehydration of MgSO4.7H2O actually proceeds through three steps: first, MgSO4.6H2O is formed after releasing one water molecule, in the second step 5.8 water molecules are released and finally MgSO4 is formed in the third step. The second dehydration step is most interesting since it is able to store ~420 kWh/m3 energy (6 times that of water) [4, 5]
• After dehydration, MgSO4 was able to take up water in a single step until MgSO4.6H2O was formed. The vapour transport between the particles is the limiting factor for hydration of magnesium sulphate [4, 5]
• The cyclability of the material at hydration temperature of 20°C was very good, however, no water uptake was observed at 40°C, which may be caused by a lower water vapour pressure. Currently, experiments are performed to investigate this observation [4].
• System studies were carried out, indicating that a large increase in solar fraction can be obtained by adding a TCM storage to a solar system with sufficient collector area. Care should be taken to find materials with a good DH (not too low for heating, but also not too high for the solar array). The system performance turned out to be very sensitive to the value of DH. Correspondingly, the system yield was found to decrease significantly if flat-plate collectors were used instead of vacuum tube collectors. [6].
• It was found that the coupling of the TCM system to a water storage tank significantly reduces the power requirements on the TCM reactor [6]. The water tank can then supply the high-power loads, while the TCM tank can afterwards recharge the water tank at a lower power level. Simulations were carried out for the case in which the solar collector system gives priority to the charging of the water tank and uses any excess heat to charge the TCM tank. However, it is now very important that the solar array is large enough to be able to provide significant charging of the TCM tank. For the case of the 15 kWh/m2/a building in Zurich (total load 7.3 GJ for space heating and 10.9 GJ for domestic hot water), it was found that the collector array required to charge a 6.6 GJ TCM storage completely was about 20 m2 vacuum tube if a TCM material with a DH of 66 kJ/mol of water was used; for higher DH the required collector area increases strongly.
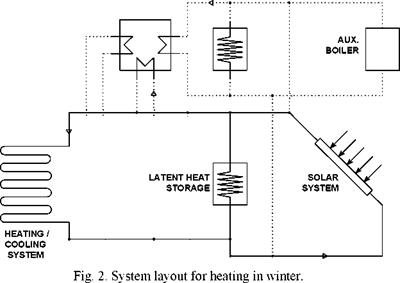
The system layout for heating in winter shows fig. 2.
|
|
Assuming a solar input of about 500 W/m2 on the 40 m2 collector field, the heat input into the storage is about 20 kW. During 6 hours in daytime therefore 120 kWh of heat can be stored for heating the building during the night. In addition, an auxillary heater can be used. In daytime, people and equipment release enough heat to raise the temperature to a comfort level. The respective storage boundary conditions of the storage including inlet and outlet temperatures are summarized in table 2.
|
Table 2. Storage boundary conditions for heating.
|
Several discharging experiments were conducted at various flow rates of the incoming cold tap water (avg 12 °C) simulating the load. These experiments are summarized in Fig. 5 showing the temperature of the heated water leaving the tank as a function of time for experiments at various flow rates (0.1-0,2 m3/h).
Fig. 5. shows that it is possible to obtain heated water with a temperature above 30 °C for between 80 and 150 minutes depending on flow rates. Water above 45 °C was obtainable for 30 to 90 minutes depending on conditions. The power during discharging ranged between 4 and 11 kW depending on flow rates.
Especially notable with the discharging process is however the fact that by the time the temperature of the outgoing water dropped below 30 °C, only between 6 and 9 kWh had been discharged as compared to the storage capacity of 14 to 15 kWh. This is presumably due to the fact that as crystallization progresses, the heat transfer rate in the HEATPACK system configuration is reduced continuously.
|
Fig. 5. Discharging of HEATPACK PCM prototype using various flow rates — hot water temperature (leaving tank) vs time. |
 |
When the amount of crystallization has yielded between 6 and 9 kWh heat, the heat transfer rate is too low to heat the cold tap water to above 30 °C.
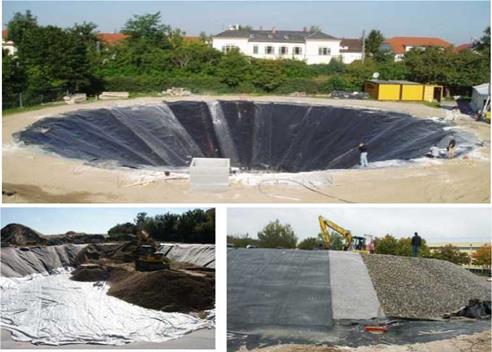
With regard to the construction of the seasonal TES in Eggenstein several boundary conditions had to be considered. As the ground water level is only 7.5 m below top ground surface, the store had to be constructed in such a way that even in the case of a hundred year flood, the thermal insulation is protected from penetration of ground water. Hence, an external HDPE liner for ground water protection was installed.
|
|
|
Fig. 5: Construction of the gravel-water pit TES |
A further limiting boundary condition is that the store is located in the area of a schoolyard. Unrestricted accessibility for the pupils and also trafficability was demanded by the customer. Obviously, a 100% safe construction — even in the case of a total failure of the liner — was required. Therefore, a concept with a gravel-water store was favoured over a hot water store.
The geometry of the store consists of two truncated cones, see Fig. 5. 2/3 of the volume of the store is located below ground surface. It is filled with 16-32 mm gravel to a height of 2.5 m. In the remaining volume the excaveted gravel/sand is refilled in order to reduce construction costs. The upper 1/3 of the store is formed as an truncated cone with washed 16-32 mm gravel. Charging and discharging of the gravel-water TES is realized by two vertical wells. One is embedded in the bottom gravel layer, the other in the top gravel laye
 An inverted truncated cone with a height of 7 m and a diameter of 35 m was excavated. The
The internal liner consists of of a HDPE membrane with vapor barrier. The aluminum layer prevents water vapour diffusion and thus protects the thermal insulation from getting wet during the entire period of operation of more than 30 years. On the present market high temperature liner materials are not available. Hence, standard geomembranes known from landfill constructions had to be used for the lining of the store. Reliable information about service lifetime of polymer liners under operation conditions of a seasonal TES is not available. Therefore, the maximum operation temperature of the store is limited to 80 °C.
Due to the situation that the ground water level is only some centimeters below the store, special attention was drawn to the design of the store with respect to insulation type and thickness. Simulations conducted by ITW and Solites yielded that an increased insulation thickness at the bottom is required. Hence, on bottom and on side walls below top ground surface 50 cm expanded glass granules was suggested. Above top ground surface 90 cm foam glass gravel form the insulation on side walls and at the top of the store. Both, foam glass gravel and expanded glass granules are pressure resistant in the required range. Foam glass gravel was favoured over expanded glass granules for the upper part as it is shapeable due to its relatively high friction angle. The resulting dimensions of the insulation corresponds to the economic optimum with regard to the material and installation costs within the limits of the available budget.
insulation
|
evacuated |
 covered with HDPE liner
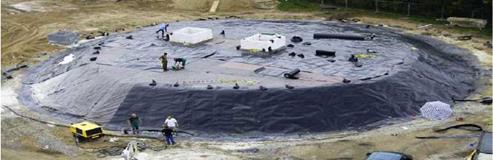
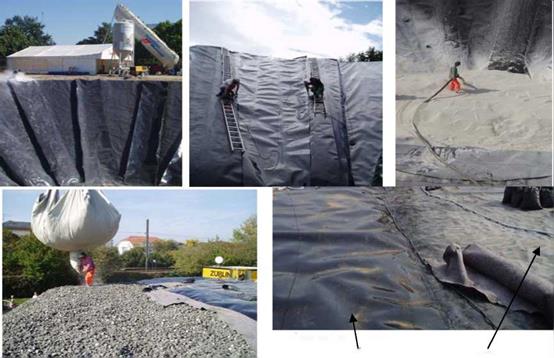
Fig. 6: Primary and secondary chambers, installation of the insulation by blowing from silo-truck into
chambers or loose; lower left: installation of the foam glass gravel by pouring from big bags. It is delivered
by trucks and filled on-site into the big bag by a front loader, lower right: filled and evacuated chamber.
In order to protect the insulation from getting wet an external liner for ground water protection was installed. The external liner and the internal barrier liner are welded together such that they form chambers, which are filled with the bulk insulation material. In total 30 primary and secondary chambers were built, see Fig. 6.
Based on a method tested in Steinfurt-Borghorst [6] a leakage detection system was established using these chambers. Preliminary tests were carried out in the framework of the R&D project “Further development of pit heat stores” at ITW [4]. As the tests showed good results the evacuation system was established. After filling the 30 chambers with the insulation they were hermetically sealed by hot air and extrusion welding technique and evacuated to roughly 0.5 bar. This procedure enables leakage detection during construction and if desired also during operation.
For future projects with gravel-water store such an evacuation system is recommended. However, it is recommended that state-of-the-art vacuum equipment is applied and that a warning system signals in case of increasing pressure.
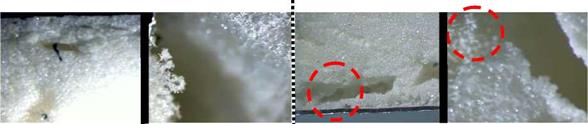
Figure 5 (a) and (b) shows the reference sandwich panel of the test 1. It is possible to see small cracks that do not contain PCM. Figure 5 (c) and (d) shows the sample with PCM, without the zoom (left) it was possible to see the cracks that contain PCM. The distribution of the PCM was visible in some areas in the middle of the sandwich panel as small cracks and sometimes close to the metal sheet.
|
(a) (b) (c) (d) Figure 5 Test 1 (a) Reference sandwich panel sample (b) Zoom of the reference sample (c) Sandwich panel with PCM (d) Zoom of the sample with PCM |
|
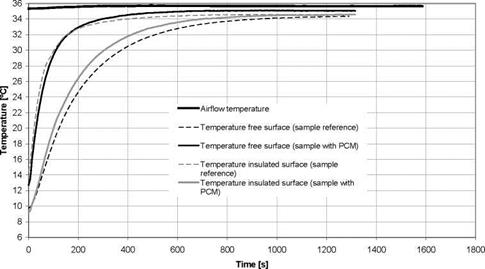
Figure 6 shows its results of thermal performance (test 1), comparing the reference sample results and the sample with PCM results it can be observed a similar behaviour of the free surface and, comparing the insulated surfaces sample with PCM does not show the effect expected (higher thermal inertia). This result is possible due to poor distribution of the PCM and the possibility of sample tested does not contain PCM. It was tested two new samples and the results were: one similar to figure 6 and the second one with a better effect of the sample with PCM (shows a delay in the temperature evolution).
|
Figure 6 Thermal performance test of the reference sandwich panel and sandwich panel with PCM (Test 1)
For this test, adhesion results between metal sheet and polyurethane foam are out of the limits (see table 2). During the performance of the adhesion test, it could be seen that the reference sandwich panel always breaks in the insulated surface, but the panel sandwich with PCM breaks in the middle.
|
Adhesion results (Test 1) |
Adhesion results (Test 2) |
Adhesion results ( Test 3) |
|
|
[MPa] |
[MPa] |
[MPa] |
|
|
Reference sandwich panel |
0.1 |
0.08 |
0.13 |
|
Sandwich panel with PCM |
0.02 |
0.01 |
0.16 |