Как выбрать гостиницу для кошек
14 декабря, 2021
Сегодня каждый, кто собирается в отпуск и не знает, с кем оставить своего котика или кошку, может во[...]
Two peaks appeared on DSC solidification curve of a Composite 3 (Fig.1), as a simple signal of inhomogeneous composite or chemical products generated during crystallization process. The recrystallization of the Composite 3 was made with DSC at a cooling/heating rate of 0.50C/min and temperature range from 150-2200C. Comparable FTIR spectral study was performed on Composite 3 for examination of the possible chemical degradation or chemical interaction (Fig.2).
|
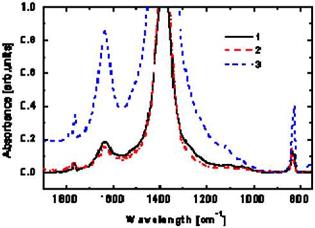
Fig.2. FTIR spectra of the (Na/K)NO3eutectics/graphite GFG (curve 1), compared to the (Na/K)NO3eutectics/graphite composite NG (curve 2), and to the (Na /K)NO3 Eutectics (curve 3). |
Relative intensities of the absorption peaks were almost the same for the two samples of salt/eutectics graphite composites Fig.2, (1), (2), but lower as compared to the single NaNO3/KNO3 eutectics (3). Evaluations of the spectra provided with an evidence of a maximum characteristic absorption band at 1379 cm-1, displayed for vibrations of the nitro functional group of NaNO3 and KNO3 compounds. Products of chemical degradation or chemical reaction were not identified from anion frequencies recorded for all samples.